


-
“The XTM team was able to go out of their way to create a tailored solution for us, and we’re looking at introducing even more automation in the future. The fact that they are localization experts makes a big difference as they truly understand our needs.”

Deepak Nagabhushana
Staff Localization Project Manager, GoTo -
"XTM forms a big global ecosystem of seamlessly connected accounts to which thousands of users connect daily. Overall, the result is better quality with fewer resources."
.webp?width=270&height=270&name=Acolad-image-270x270%20(1).webp)
Vincent Rigal
CAT Tools Products Owner, Acolad -
“XTM stood out because it made it possible and easy for all our freelancers to work on a single, centralized platform. This enables us to monitor progress, and after the completion of a job, we can easily allocate that license to another vendor. This makes my daily tasks a lot easier, and I can focus on other value-added tasks.”
.jpg?width=472&height=536&name=admin-ajax%20(1).jpg)
Elisabeth Feulner
Project Manager, Allround Service -
“With XTM, we can now offer all customers across the world the same level of support and access to every new product we launch more quickly while reducing costs and errors, and ensuring consistency across all content.”

Dominic Pemberton
VP of Content, RS Group -
“There’s no way we could be running the same operations today if we didn’t have the right tech stack in place.”

Alex Katsambas
Senior Head of Localization Services, FARFETCH -
“We had a phenomenal setup with our content management system feeding automatically into and out of XTM. Now we’re able to harness the very best of both machine translation and human editing for outstanding cost efficiency.”

Ronald Egle
Content Systems Administrator, Ariel Corporation -
“One of the delightful functionalities of XTM is its custom analysis templates, which can extract content from any complex source file format, like Java, send it for translation and then convert it back to its original format upon completion of the work.”
Deepak Nagabhushana
Staff Localization Project Manager, GoTo -
“Since implementing XTM, the volume of translated words for our most frequent language pairs has increased by approximately 10%. This wouldn’t have been possible without all the added automation a TMS provides.”
Elisabeth Feulner
Project Manager, Allround Service -
“XTM has been instrumental in streamlining our language solutions at THG Fluently – Ingenuity Commerce. With centralized resources, improved project visibility, and enhanced communication management, we have achieved greater productivity, cost savings, and client satisfaction.”
.jpg?width=600&height=579&name=admin-ajax%20(2).jpg)
Daniela Gorry
Operations Director, Translations at THG Fluently – Ingenuity Commerce -
“XTM has become an integral part of our translation workflows, enabling us to deliver high-quality services to our clients efficiently and effectively.”
Daniela Gorry
Operations Director, Translations at THG Fluently – Ingenuity Commerce
Real-time reporting and analytics for LSPs
Get real-time visibility into localisation performance with customisable dashboards and actionable insights. Our translation business management system reporting transforms data into strategy, helping teams optimise operations and demonstrate ROI.
/XTM%20Cloud%20-%20Metrics%20cards.webp)
Trusted by teams at over 1,000 of the world’s leading organisations
.png)


Turn your localisation data into business insight
Get full visibility into performance, profitability, and productivity with real-time dashboards and analytics that help every team make smarter, faster decisions.
-

Monitor business performance in real time
-
See only the metrics that matter
-
Identify opportunities with benchmark analytics
-
Share and integrate your data easily
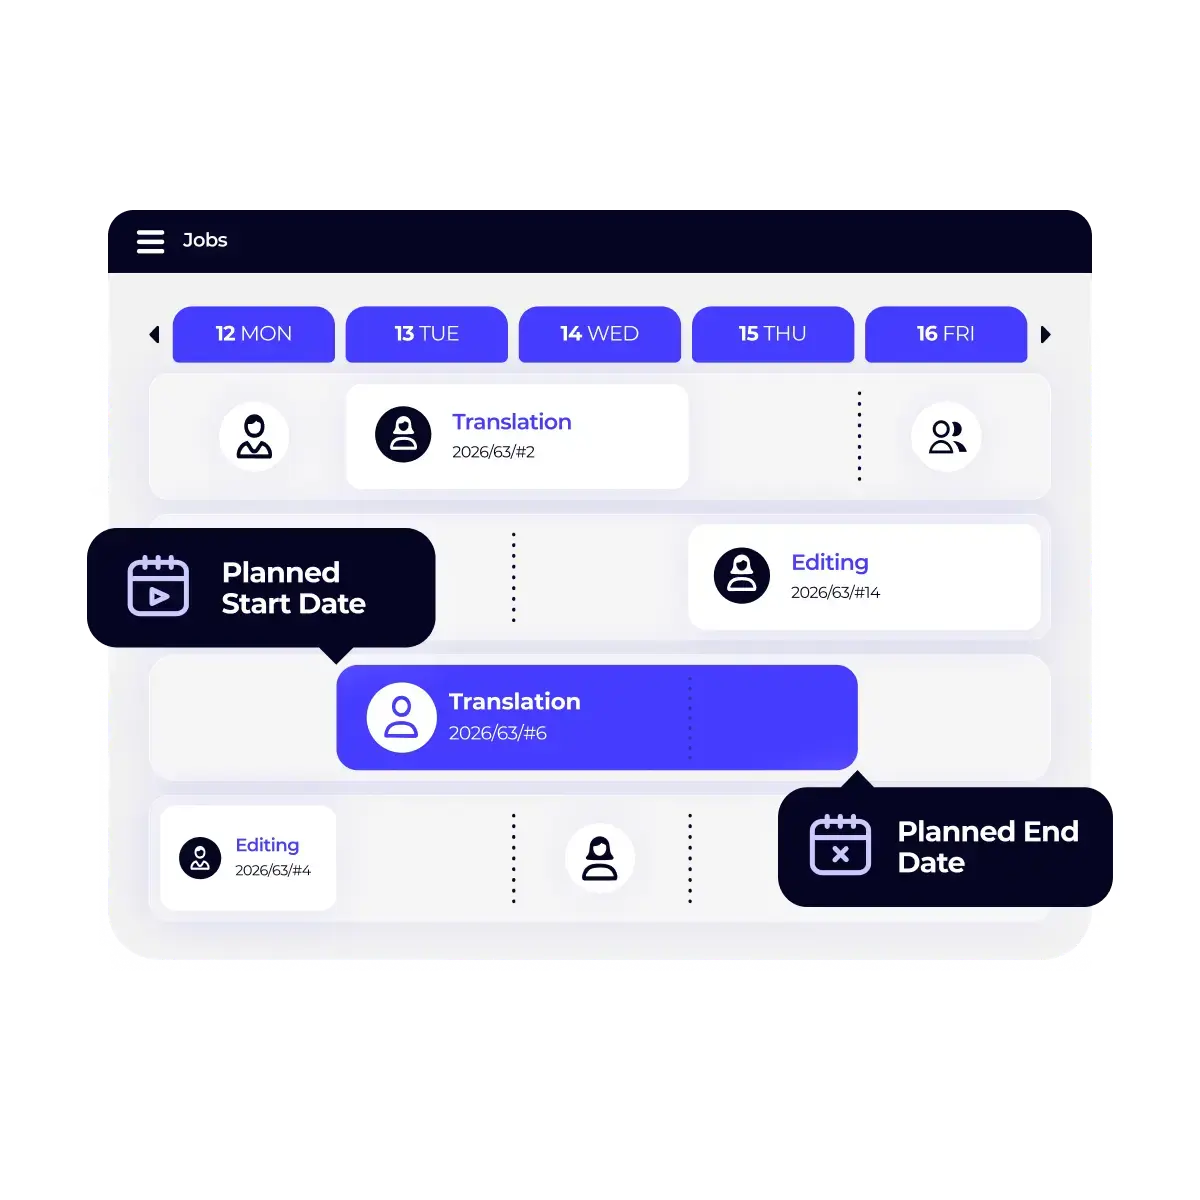
Monitor business performance in real time
Track project flow, client activity, and service trends through visual dashboards that reveal operational health instantly and keep every stakeholder aligned.

See only the metrics that matter
Tailor dashboards for each role, whether operations, sales or finance. Filter by time period, language pair, or project status so every stakeholder sees what matters most to them.

Identify opportunities with benchmark analytics
Compare client results, vendor reliability, and team capacity to uncover strengths, close performance gaps, and make smarter business and resource decisions.
/XTRF%20-%20Smart%20vendor%20matching%20-%20Vendor%20selection%20rules.webp?width=500&height=500&name=XTRF%20-%20Smart%20vendor%20matching%20-%20Vendor%20selection%20rules.webp)
Share and integrate your data easily
Export reports in XLS, PDF, or CSV for presentations or offline analysis. Connect with BigQuery or APIs to combine data across business systems for deeper insights.
Monitor business performance in real time
Track project flow, client activity, and service trends through visual dashboards that reveal operational health instantly and keep every stakeholder aligned.
See only the metrics that matter
Tailor dashboards for each role, whether operations, sales or finance. Filter by time period, language pair, or project status so every stakeholder sees what matters most to them.
Identify opportunities with benchmark analytics
Compare client results, vendor reliability, and team capacity to uncover strengths, close performance gaps, and make smarter business and resource decisions.
Share and integrate your data easily
Export reports in XLS, PDF, or CSV for presentations or offline analysis. Connect with BigQuery or APIs to combine data across business systems for deeper insights.
XTRF BigQuery
Unlock deeper business intelligence by querying your XTRF data at scale with Google BigQuery. Go beyond dashboards to build custom reports that reveal profitability, client patterns, and performance insights that help you optimise and grow.
- Analyse project delivery, ROI, and margin trends across dimensions
- Reveal translator performance, language demand, and workload patterns
- Generate tailored reports that support strategic and operational decisions
/XTM%20Cloud%20-%20Dashboard%20Productivity.webp)
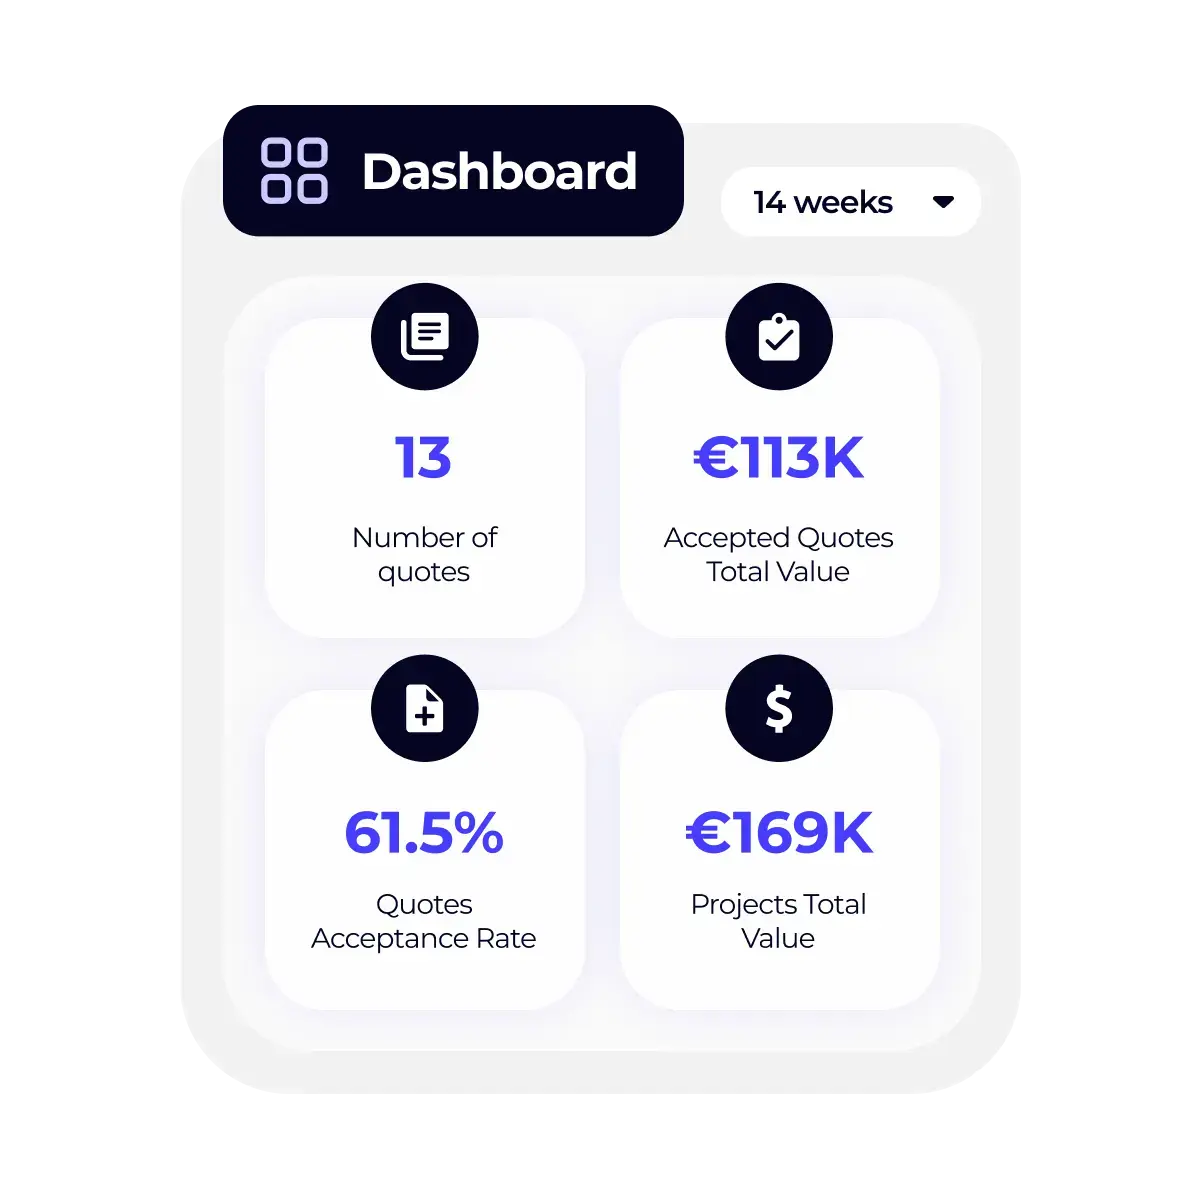
XTRF Business Barometer
Get a clear, real-time view of your localisation business performance so you can spot trends, make smarter decisions, and act with confidence.
Business Barometer turns your XTRF data into insight you can use every day.
- See key performance trends for quotes, projects, and clients at a glance
- Track acceptance rates, revenue shifts, and upsell opportunities
- Make strategic decisions backed by data, not guesswork
Discover everything our TBMS can do for you
Our translation business management system gives you the visibility, automation, and control to manage every aspect of localisation — from vendor collaboration to financial reporting — all in one platform
Automated reporting saves project managers hours
See what our customers say about XTM.


Connect with your favorite business tools
We connect with the software you already use to create a unified workflow across your entire organisation.


.svg.png)


See your localisation data in action
Ready to move from guesswork to data-driven decisions? Book a personalised demo and discover how our reporting and analytics capabilities can improve your translation operations.